


BiZZdesign release news – vol. 3
Audience: BiZZdesign user
The continuation of the BiZZdesign release news series brings you an overview of newly added functionalities and resolved bugs. Although only a month has passed since the last article, BiZZdesign is advancing and therefore I will describe 4 new releases in this article.
The latest version of BiZZdesign is marked 4 and its latest release was released on April 14, 2021. Cloud solutions are upgraded automatically after the release of a new version / release. However, on-premise solutions are updated by customers at their own discretion. A quick and always up-to-date description of the news can be found at the following link: Latest release.
News of version 4 from April 15, 2021
- Use of population hierarchy in Landscape map
- Data block editing improvements
- Direct relation editing and use of population hierarchy in matrix chart
- Additional filtering options for charts
- Profile-based graphical properties on viewpoint definitions
- Support for custom icon symbols on viewpoint definitions
- AWS architecture icons available as graphic shapes
- Value stream concept available for activities in Business Model Canvas
- Improved log entry text about license
- End of life for LeanCoach
- End of life for ArchiMate CSV import and export
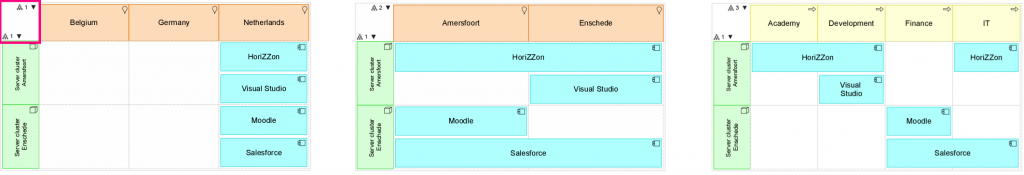
1. Use of population hierarchy in Landscape map
Landscape map newly supports the definition of the hierarchy population in the X and Y axis, which allows you to display only selected elements of the population that are defined at a certain level of the hierarchy. The complete procedure for population definition is available in the online documentation: Using hierarchy in an ArchiMate Landscape map.
2. Data block editing improvements
In order to improve and streamline the work with Data Blocks, the changes described below have been implemented. These changes apply to the Properties panel as well as the Data entry page of the model package.
- by clicking directly on the Data Block, it is possible to make its modification
- you can use the TAB key to navigate through the fields and buttons of the Data Block
- after leaving the Data Block field, all changes are automatically saved
- when editing a Data Block, pressing the ENTER key will save the changes and exit the editing mode
- when editing a Data Block, pressing the ESCAPE key exits the edit mode without saving changes
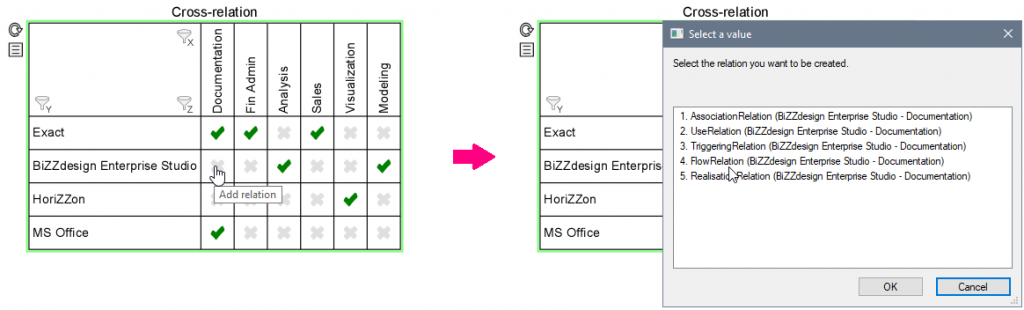
3. Direct relation editing and use of population hierarchy in matrix chart
In the matrix, it is necessary to activate Advanced options in the settings to activate this new functionality.
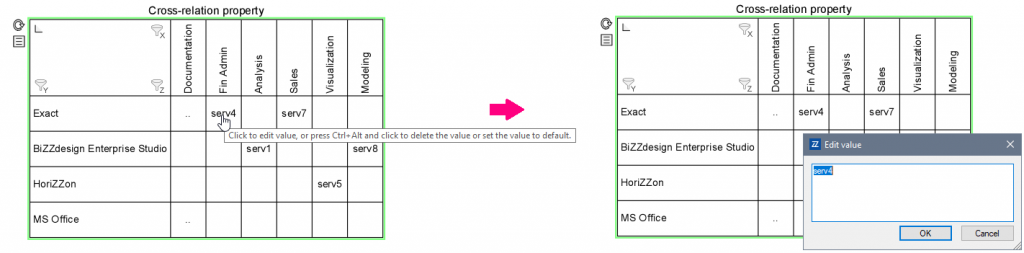
The matrix now supports the direct creation and deletion of relationships and the modification of relationship properties for the Cross-relation and Cross-relation property matrix types. To achieve this, you need to switch the graph to Representation tab. You can then delete existing relationships and add new relationships (Cross-relation matrix) or modify existing relationship properties (Cross-relation property).
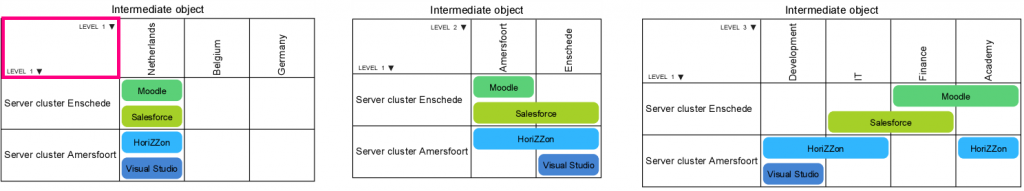
The matrix now supports the definition of hierarchy population in the X and Y axis. This allows you to display a chart only for population elements that are defined at a certain level in the hierarchy. The use of a hierarchy is supported for each matrix type. By specifying the populations that must use the Representation tab and use the aggregation / composition in the hierarchy (Definition tab) and adding the correct filters, you can include the hierarchy in the chart. A detailed description of this functionality is available in the online documentation: Using hierarchy in a matrix chart.
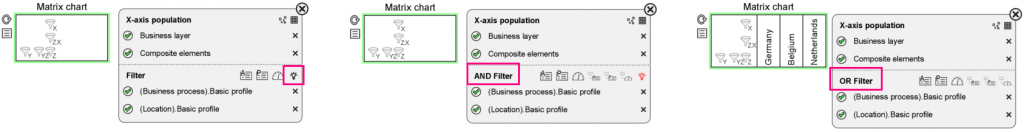
4. Additional filtering options for charts
Filtering chart now also offers the possibility of using the OR clause and filtering through the values of relevant profiles, attributes and metrics. These new options are available in all chart types. In the matrix chart type, it is necessary to activate the Advanced options in the settings for their activation.
Until now, filters in graphs only supported AND filtering. OR filters can now be used. To switch from AND to OR filtering, click the light bulb icon in the chart population window and click AND in the filter section title. To switch back to AND filtering, click OR in the filter section title.
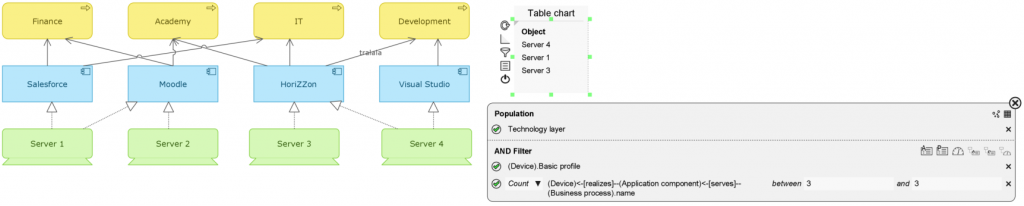
Filtering the chart population is now also possible according to the values of related attributes, profiles and metrics. These are filters for the values of attributes, profiles, and metrics of objects that are accessed through a relationship. An example is given below. The table chart shows the devices that (via the application components) serve the three business processes.
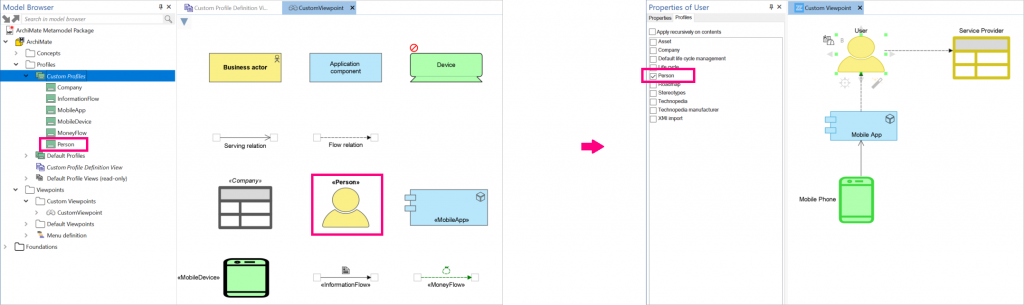
5. Profile-based graphical properties on viewpoint definitions
Through the Metamodeler function it is possible to create custom definitions of profiles, attributes, or views and diagrams (online documentation: Metamodeler). After the new one, when defining your own view, it is possible to add profiles to the definition, in addition to objects and relationships, and specify graphic properties for them (e.g. change of shape). If such a profile is assigned to an object during modeling, the object changes its graphical properties according to the definition of this profile.
6. Support for custom icon symbols on viewpoint definitions
We can also add this novelty to the above-mentioned point, which describes the extension of Metamodeler functionality. After the new one, when defining your own view, it is possible to change the icons (symbols) of objects using custom icons. To do this, you need to add custom icons to the Symboldefinitions folder in the tool configuration. When creating a concept in the aspect definition, you can select your custom icon by entering its name (or part of it) in the search box at the top of the icon selection window.
7. AWS architecture icons available as graphic shapes
To support cloud architecture modeling, a selection of the most used AWS architecture icons has been added to Enterprise Studio. They can be selected using the Change Graphic Shape function via the object's context menu.
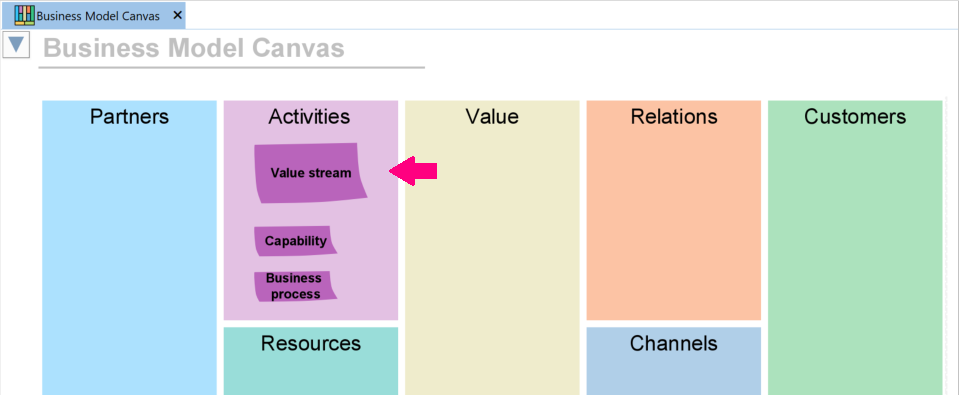
8. Value stream concept available for activities in Business Model Canvas
The Value Stream concept can now be added to the Activities section of the Business Model Canvas.
9. Improved log entry text about license
The text of the slightly misleading "Could not parse license key according to new format" entry in the EnterpriseStudio.log file (Team Data folder on devices with Enterprise Studio installed) has been changed to better reflect what is happening, namely that the license is being verified.
10. End of life for LeanCoach
Support for LeanCoach models in BiZZdesign tools will end in March 2022. Until the end of support, the model will be in the "Extended support" state, which means that support through the support portal will only address requirements and issues with priority 1 and 2. At the same time it is not possible to create new LeanCoach models. However, existing models remain supported.
11. End of life for ArchiMate CSV import and export
Support for ArchiMate's CSV import and export features in BiZZdesign will end in April 2022. Until support ends, these features will be in the "Extended support" state, meaning that support through the support portal will only address requirements and issues with priority 1 and 2. This is a duplicate functionality, as the import and export of CSV files can also be implemented using BiZZdesign Connect. A complete description of this functionality is available in the online documentation: Data integration with Excel.
Selection of removed bugs in version 4 from 4 from April 14, 2021
TP-10653 – HoriZZon
HoriZZon was updated every 5 minutes, which could result in the loss of unsaved changes or a flashing HoriZZon window every 5 minutes.
TP-12008 – Team Platform
The web browser did not authenticate itself on the HoriZZon server (by redirecting to authentication every 5 minutes). An error was encountered when the request failed due to authentication.
TP-11834 – Team Platform
In some situations, users may be able to obtain information about users and groups that should not be available for their role.
TP-6527- BPMN
It was not possible to move the BPMN data store to another Items collection in Model Browser.
TP-10543 – Metamodeler
It was not possible to rename new custom Viewpoint definitions and apply a translation table to them in the Model Browser or Properties panel.
TP-11832 – Team Platform
Access tokens may have been misused on the HoriZZon server.
TP-11933 – Team Platform
Data migration in the Activity Console took too long, which resulted in an "Unable to establish a connection to the Activity Console" message in Enterprise Studio.